EDA with Titanic Dataset - Literature
The Titanic data set is a famous data set that beginners in Machine Learning always refer to. However, the data set presents some interesting EDA opportunities which can be applied towards further complex problems.
Problem Description
The sinking of the Titanic is one of the most infamous shipwrecks in history.
On April 15, 1912, during her maiden voyage, the widely considered “unsinkable” RMS Titanic sank after colliding with an iceberg. Unfortunately, there weren’t enough lifeboats for everyone onboard, resulting in the death of 1502 out of 2224 passengers and crew.
While there was some element of luck involved in surviving, it seems some groups of people were more likely to survive than others.
In this article, we perform an Exploratory Data Analysis(EDA) which will show trends on what sorts of people were more likely to survive. We will passenger data (ie name, age, gender, socio-economic class, etc) obtained from Kaggle.
Data Dictionary:
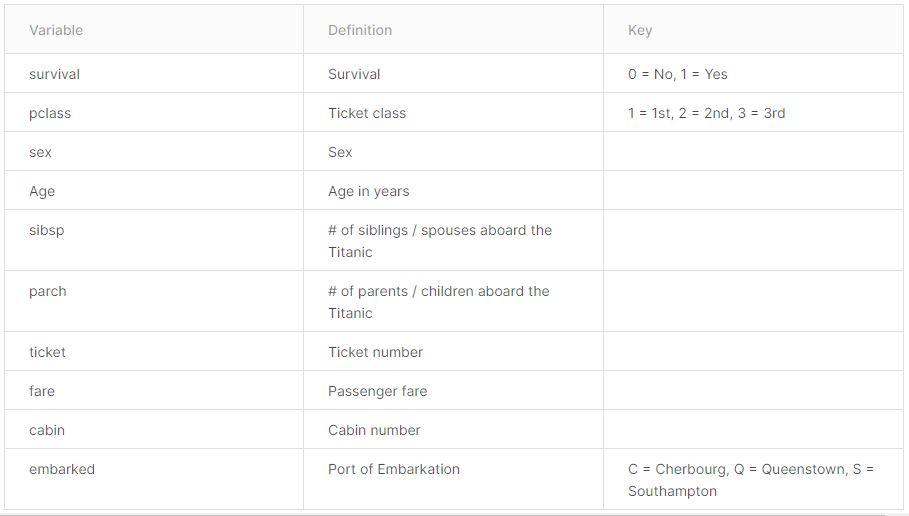
Assumptions:
The following has been assumed with respect to some of the variables and further has been used to derive some additional variables for better analysis.
pclass: This variable is a proxy for socio-economic status (SES)
-
1st = Upper
-
2nd = Middle
-
3rd = Lower
age: This variable provides information about the age of the passenger
-
Age is fractional if less than 1.
-
If the age is estimated, is it in the form of xx.5
sibsp: The variable defines family relations in this way…
-
Sibling = brother, sister, stepbrother, stepsister
-
Spouse = husband, wife (mistresses and fiances have been ignored)
parch: This variable defines family relations in this way…
-
Parent = mother, father
-
Child = daughter, son, stepdaughter, stepson
-
Some children traveled only with a nanny, therefore parch=0 for them.
Feature Engineering
The following Feature Engineering tasks were done.
-
Expanded the acronym C, S, Q for the Embarked Variable with Cherbourg, Southampton & Queenstown respectively
-
Expanded the acronym 1,2,3 for the Pclass Variable with 1st Class, 2nd Class & 3rd Class respectively
-
determined whether a passenger is a minor depending on his/her age(age <18) and stored that in a different variable.
-
Created new variables age_group and age_range based on the passengers age.
-
Determined whether a passenger is married or single from their name, age and sex.
-
Determined Travel companion of the passengers out of Sibling/Spouse and Parent/Children data.
-
Determined the fare_range from the fare variable.
-
Filled the rows of Cabin Variable with ‘Not in a Cabin” which were earlier empty. Else we would have to remove this variable as only 23% of the passengers had a cabin.
Missing Value Treatment
- The missing value in the Age variable has been imputed with mean age.
Summary
Let’s start with the summary of ideas that will be presented in the notebook:
The data set from the data quality point of view has some missing data, but they do not impact the analysis that much as we have feature engineered these variables and also derived some other variables from these variables that resulted in a clear analysis. Although there is a discrepancy between the number of tickets and passengers(it looks like a single ticket was shared among multiple passengers) and the sum of the records (training and test datasets). There has also been no information regarding the crew members with their details, so nothing is known about them, but the goal of the analysis is to determine the factors why some passengers survived.
A number of interesting yet relatable insights were found:
-
more men passengers died than female passengers
-
most adult men between the ages 18 and 65 did not survive (even though we have a percentage of data where the age is not known and we used missing value imputation.)
-
first class passengers were given or automatically got priority over the other classes in getting rescued.
-
Fare is a misleading feature and cannot be easily correlated to survival, as it is linked to few other features like Passenger class, Cabin and Ticket
-
Passenger class, Cabin, Ticket and Fare together give a better picture of survival
-
we know a number of passengers across all three passenger classes have overpaid for their tickets and we can easily point them. Maybe they bought tickets to board the ship in the black-market.
-
a strange fact that ones who boarded from Southampton took the most of the death toll
-
we found passengers passengers who have traveled with a ticket priced £0.00 across all three classes
-
to sum it up, first class female passengers stood a better chance of surviving
-
those that traveled with a company i.e. family or friend had a higher chance of survival than those who traveled by themselves, although ones with less able dependents suffered to a visible degree
-
it appears that most men were helping women, children and elderly and other less able passengers to board off the ship and in turn minimized their own chances of survival, leading to 81% male casualties
Code
The Jupyter notebook for the entire exercise is available at this link, with options to view and run the code on Google Collab!
Please check it out.